









































Shiba Inu Faces Sharp Correction Amid Market Volatility
The cryptocurrency market is known for its extreme volatility, and the recent performance of Shiba Inu serves as a prime example of this rapid price action. After a promising rally that captured the attention of investors worldwide, the Shiba Inu price analysis reveals a significant downturn. The token has dropped approximately 20% from its recent high, causing a stir among the ShibArmy and raising questions about the immediate future of this popular meme coin. This decline comes at a time when the broader market is experiencing a pullback, but the magnitude of SHIBs movement warrants a closer look at the underlying factors driving this bearish trend.
For traders and investors alike, understanding the mechanics behind such a drop is crucial. Is this merely a healthy correction within a larger bullish trend, or is it the start of a deeper decline? In this detailed market analysis, we will dissect the technical indicators, on-chain metrics, and market sentiment to provide a comprehensive view of the current situation. By examining support and resistance levels alongside trading volume data, we aim to determine if this represents a buying opportunity or a signal to retreat. As we navigate these choppy waters, keeping an eye on the latest crypto news remains essential for staying ahead of market movements.
Technical Analysis: Decoding the Chart Patterns
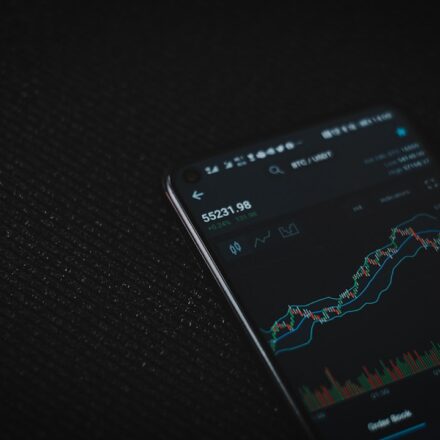
When evaluating the recent price collapse of Shiba Inu, technical analysis offers a visual roadmap of market psychology. The 20% drop did not occur in a vacuum; it was preceded by specific chart formations that, in hindsight, signaled a reversal. The asset had reached a critical resistance level where selling pressure overwhelmed buying momentum.
One of the primary indicators to watch is the Relative Strength Index, commonly known as RSI. Prior to the drop, the daily RSI for SHIB entered overbought territory, typically reading above 70. This suggests that the asset was overvalued relative to recent price action and that a pullback was mathematically probable. As the price began to descend, the RSI adjusted accordingly, moving back toward neutral levels. This normalization is often a necessary step for a sustainable uptrend to resume, provided that support levels hold firm.
Identifying Key Support Levels
For investors considering an entry point, identifying strong support zones is the first step in risk management. The recent decline saw SHIB testing a major support cluster that aligns with previous consolidation phases. This area represents a battleground where buyers have historically stepped in to defend the asset.
- Primary Support: The immediate support level coincides with the 0.382 Fibonacci retracement level of the last major upward move.
- Secondary Support: A deeper floor exists at the 200-day Exponential Moving Average (EMA), which often acts as a dynamic support level in long-term bull markets.
- Psychological Support: Round numbers often serve as psychological barriers. specific price decimals ending in zeros tend to trigger buy orders from retail investors.
If the price fails to hold at these levels, we could see a further decline toward the next liquidity pool. However, a strong bounce from these zones would confirm that the bulls are still in control and that the recent drop was merely a liquidity grab. This technical perspective is a cornerstone of effective market analysis and helps in setting realistic stop-loss levels.
Resistance Zones and Bearish Divergence
On the flip side, resistance levels now act as ceilings that the price must break through to establish a new all-time high. The recent high was rejected at a critical resistance level heavily populated by limit sell orders. More concerning is the presence of bearish divergence on the daily timeframe. This occurs when the price makes a higher high, but the momentum indicator makes a lower high.
This divergence is a classic warning sign that buying momentum is waning even as the price grinds higher. It often precedes sharp corrections, exactly as we have witnessed. For SHIB to regain its bullish trajectory, it must first reclaim the resistance level that recently turned into support. Until that happens, the path of least resistance remains to the downside, or at best, sideways consolidation.
Fundamental Drivers and On-Chain Metrics
While price charts tell us what is happening, fundamental analysis and on-chain metrics explain why it is happening. The Shiba Inu ecosystem has evolved significantly since its inception as a simple meme coin. The development of Shibarium, the Layer 2 blockchain solution, aims to reduce transaction fees and increase utility, which theoretically should bolster the long-term value of the token.
However, short-term price action is often driven by network activity metrics. Data from on-chain analytics provides insight into the behavior of large holders, often referred to as whales. During the recent rally, there was a noticeable spike in large transaction volume, indicating that whales were active. Unfortunately, the subsequent drop suggests that some of these large holders took profit, adding immense selling pressure to the market.
Furthermore, the burn rate of SHIB tokens is a critical factor that investors monitor. In a deflationary model, reducing the total supply should theoretically increase scarcity and drive up price. Yet, the impact of burns often lags behind market sentiment. During the recent drop, burn rates may have remained stable or increased, but this fundamental utility was not enough to overpower the macroeconomic headwinds affecting risk assets. For those looking into new cryptocurrencies, utility is key, and SHIB is fighting to prove its long-term value beyond mere speculation.
Shibarium Transaction Volume
The health of the Shibarium network is vital for the future of Shiba Inu. Low transaction fees and high throughput are designed to attract developers and users. If transaction volume on Shibarium remains high during a price dip, it signals strong fundamental usage and conviction from users. Conversely, a drop in network activity coupled with a price drop is a bearish signal.
Recent data indicates that while transaction volume fluctuates, the network continues to process a significant number of operations. This suggests that the ecosystem is growing despite price volatility. Investors should look for an increase in total value locked (TVL) within the Shibarium ecosystem as a confirmation of long-term health. As the team continues to roll out upcoming projects on this network, utility-driven demand may eventually override speculative trading patterns.
Token Burn Mechanics and Supply Dynamics
The community often rallies around burn events. These involve sending tokens to a dead wallet, effectively removing them from circulation. While individual burns may seem small, the cumulative effect over time can be substantial. However, reliance on burns as a primary price driver can be risky in a bear market.
The 20% drop highlights that supply reduction alone cannot sustain a price rally during a market-wide sell-off. Demand must be present to absorb the selling pressure. Investors should view token burns as a long-term tailwind rather than a short-term catalyst. The focus should remain on increasing adoption and use cases that create organic demand for the token, rather than solely relying on supply shocks to prop up the price.
Market Sentiment and Broader Crypto Context
Shiba Inu does not exist in a vacuum. It is heavily correlated with the price movements of Bitcoin and Ethereum. When the market leader Bitcoin corrects, alternative coins, or altcoins, tend to correct much more sharply. This beta effect means that SHIB is inherently riskier than blue-chip cryptocurrencies. The recent 20% drop is likely exacerbated by a broader risk-off sentiment in the financial markets.
Social media sentiment plays a disproportionate role in the price of SHIB. Being a community-driven coin, hype and fear spread rapidly through platforms like X (formerly Twitter) and Telegram. During the rally, sentiment metrics reached extreme greed levels. Following the drop, sentiment has shifted toward fear and uncertainty.
This shift in sentiment is actually a healthy part of the market cycle. Extreme greed often marks market tops, while extreme fear frequently marks bottoms. TheFear and Greed Index for the crypto market can serve as a contrarian indicator. If the current drop has driven the index into extreme fear, it may suggest that the worst of the selling pressure is nearing its end, at least in the short term.
Correlation with Bitcoin and Ethereum
Understanding the correlation matrix is essential for timing entries. SHIB typically moves in tandem with Ethereum, given that it is an ERC-20 token. If Ethereum breaks below key support levels, SHIB is likely to follow suit. Conversely, a recovery in ETH often provides the liquidity needed for SHIB to rally.
Traders should keep a close eye on Bitcoin dominance. When Bitcoin dominance rises, it usually means capital is flowing out of altcoins and into Bitcoin. This scenario creates a headwind for SHIB. A buying signal for SHIB often coincides with a stabilization or decrease in Bitcoin dominance, indicating that capital is rotating back into riskier assets.
Social Volume and Engagement
Analyzing social volume gives us a glimpse into retail interest. A high social volume combined with a declining price is often a sign of a local bottom, as it indicates panic selling. Conversely, low social volume during a price rise suggests a lack of conviction and potential for a reversal.
Currently, the spike in social volume following the price drop indicates that the community is highly engaged and concerned. This heightened attention can sometimes act as a floor, as loyal supporters, known as the ShibArmy, look to buy the dip. However, if the price continues to fall and social volume declines, it could signal a loss of interest, which would be bearish for the medium term.
Implications for Investors and Traders
For those holding SHIB through the volatility, the question remains whether to hold, sell, or accumulate. The answer depends entirely on the individual investment horizon and risk tolerance. Swing traders might view the current support levels as an optimal entry point for a quick bounce, provided that stop-loss orders are placed just below the identified support floors.
Long-term investors, on the other hand, should focus on the fundamentals of the ecosystem. A 20% drop is a routine event in the crypto space and should not shake the conviction of those who believe in the roadmap of the project. The continued development of Shibarium and strategic partnerships are more relevant to long-term value than short-term price fluctuations.
Risk management is paramount. It is never advisable to go all-in on a single asset, especially one as volatile as a meme coin. Diversifying across different sectors of the crypto market, including blue-chip assets and stablecoins, can mitigate the impact of a downturn. Additionally, participating in airdrops and rewards can provide alternative streams of income that offset portfolio volatility.
Strategies for Navigating Volatility
One effective strategy during such uncertain times is dollar-cost averaging (DCA). Instead of trying to time the exact bottom, investors can purchase smaller amounts at regular intervals. This reduces the impact of volatility and lowers the average entry price over time.
Another strategy involves waiting for confirmation. Rather than catching a falling knife, traders can wait for a higher high to be printed on the daily chart. This confirms that the trend has reversed. While this means buying in at a slightly higher price, it significantly increases the probability of a successful trade.
Forward-Looking Analysis
Looking ahead, the path for Shiba Inu will likely be determined by the broader market recovery. If Bitcoin and Ethereum can stabilize and begin their ascent, SHIB is well-positioned to outperform due to its high beta nature. The community remains one of the strongest in the crypto world, and this collective power is a formidable asset.
However, risks remain. Regulatory scrutiny on the crypto industry is increasing, and meme coins are often targeted for their lack of intrinsic value. Furthermore, the macroeconomic environment, including interest rates and inflation data, will continue to influence risk appetite.
In conclusion, the 20% drop from recent highs is a significant event but not necessarily a catastrophic one. It presents both risks and opportunities. By adhering to strict technical analysis, monitoring on-chain health, and maintaining a disciplined investment strategy, market participants can navigate this turbulence. For now, the market suggests caution, but for the bulls who remain steadfast, the current levels may eventually be viewed as a discounted entry point before the next leg up.